Behaviour
The Behavior metrics (New vs. Returning, Frequency & Recency, Time Trends,etc.) Measure the pull of your Mobile Application, and the extent to which you’re encouraging first-time users to return. You can also see the economic impact of new vs. returning users metrics. This lets you know how well your Mobile Application engages users, whether they’re leaving after viewing only a single page (Bounce Rate), whether they’re viewing multiple pages (Pages / Session), and whether they’re spending the amount of time engaging with your content that you’d like.
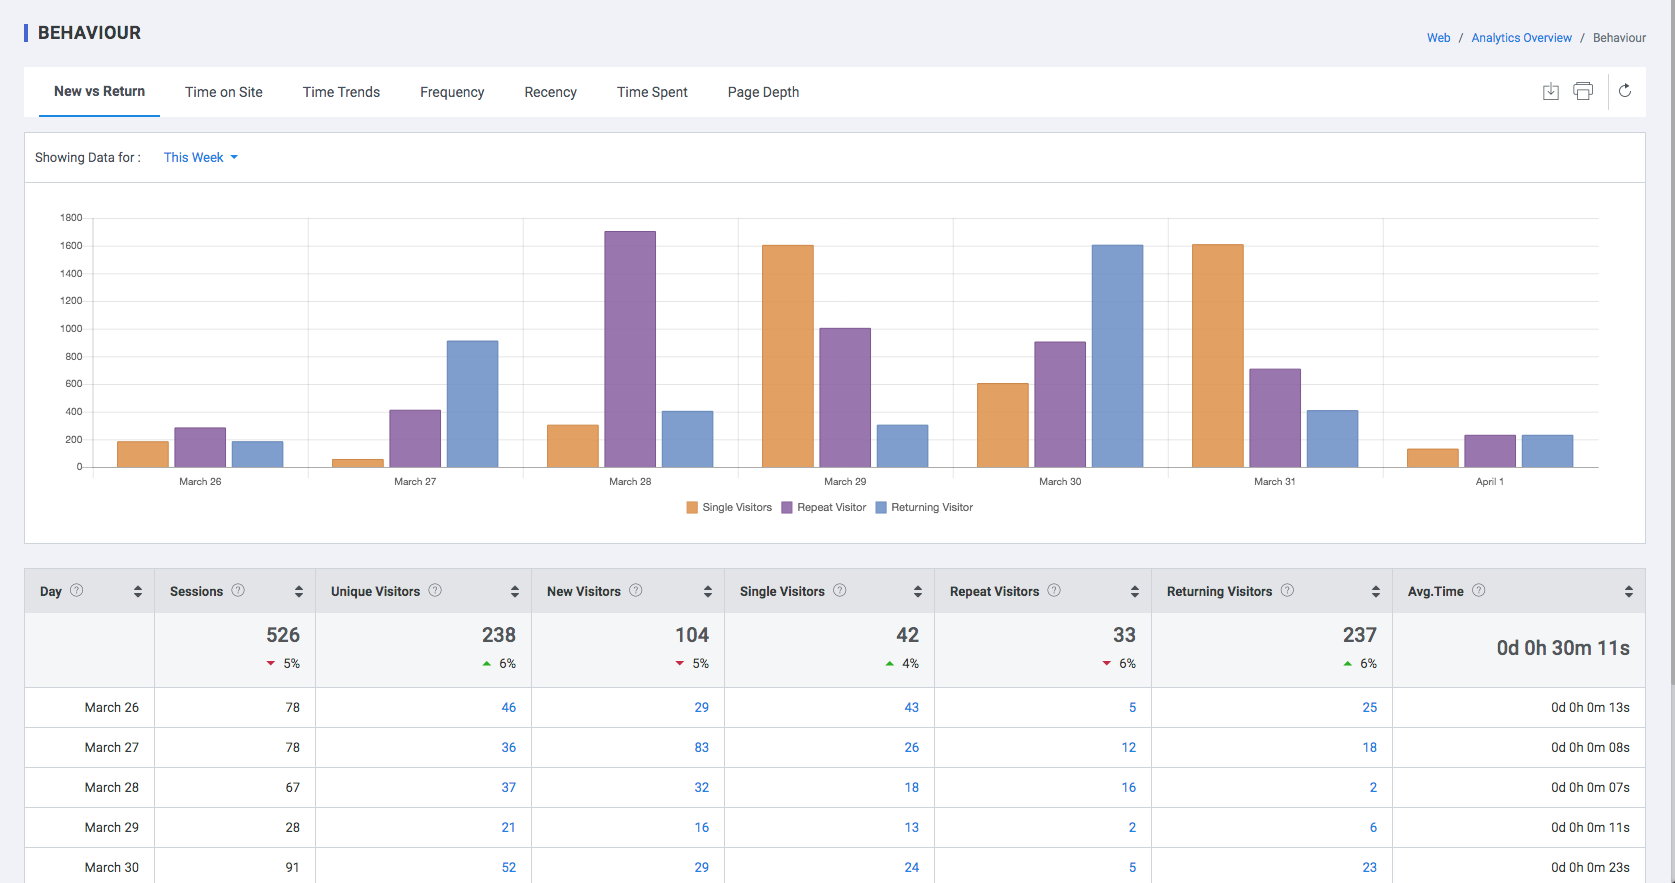
New vs. Returning users
New users are users who have never been to your Mobile Application, according to plumb5’s tracking snippet; returning users have visited your Mobile Application before.When someone views your Mobile Application, plumb5’s tracking snippet looks for a tracking cookie on their device:
- If the cookie is not present, plumb5 creates one and considers this a ‘new’ user
- If the cookie is present, plumb5 considers this a ‘returning’ user and starts a new session
plumb5 Analytics distinguishes users who engage with your Mobile Application by setting a cookie that keeps track of the domain, the number and time of previous visits, traffic source, and the start and end of a session. To determine if a user is new or returning, plumb5 Analytics creates a randomly generated string for a Client ID field stored within a user's browser cookie:
Using this string, plumb5 Analytics can match and label any additional sessions coming from the same browser on the same device as a session by a returning user—but in any other scenario, plumb5 has no way to to do the same:
- If a visitor accesses your Mobile Application from multiple devices (for example, a laptop first and a smartphone later), plumb5 Analytics will count visits from each device as coming from a different user till the user is tagged via an EMail or Phone Number that can be acquired using Web Engagements.
- If a visitor has multiple browsers on the same device and uses them interchangeably, plumb5 Analytics will assign a separate client ID to each
- If a visitor regularly deletes or blocks cookies, they will be counted as new every time they come back to your Mobile Application after cookie deletion
- Visitors who use Incognito or Private Browsing Mode on their browsers will always appear as new users, as the browser won’t save cookies and/or Mobile Application data
To sum up: when it comes to users, your plumb5 Analytics data will always be somewhat skewed because of different devices, browsers, and privacy settings and options.
In other words, when you read that you had ‘10,000’ users last month, you’re probably imagining 10,000 different people—but in reality you should imagine 10,000 different Client IDs instead, knowing that some of them may belong to the same person.
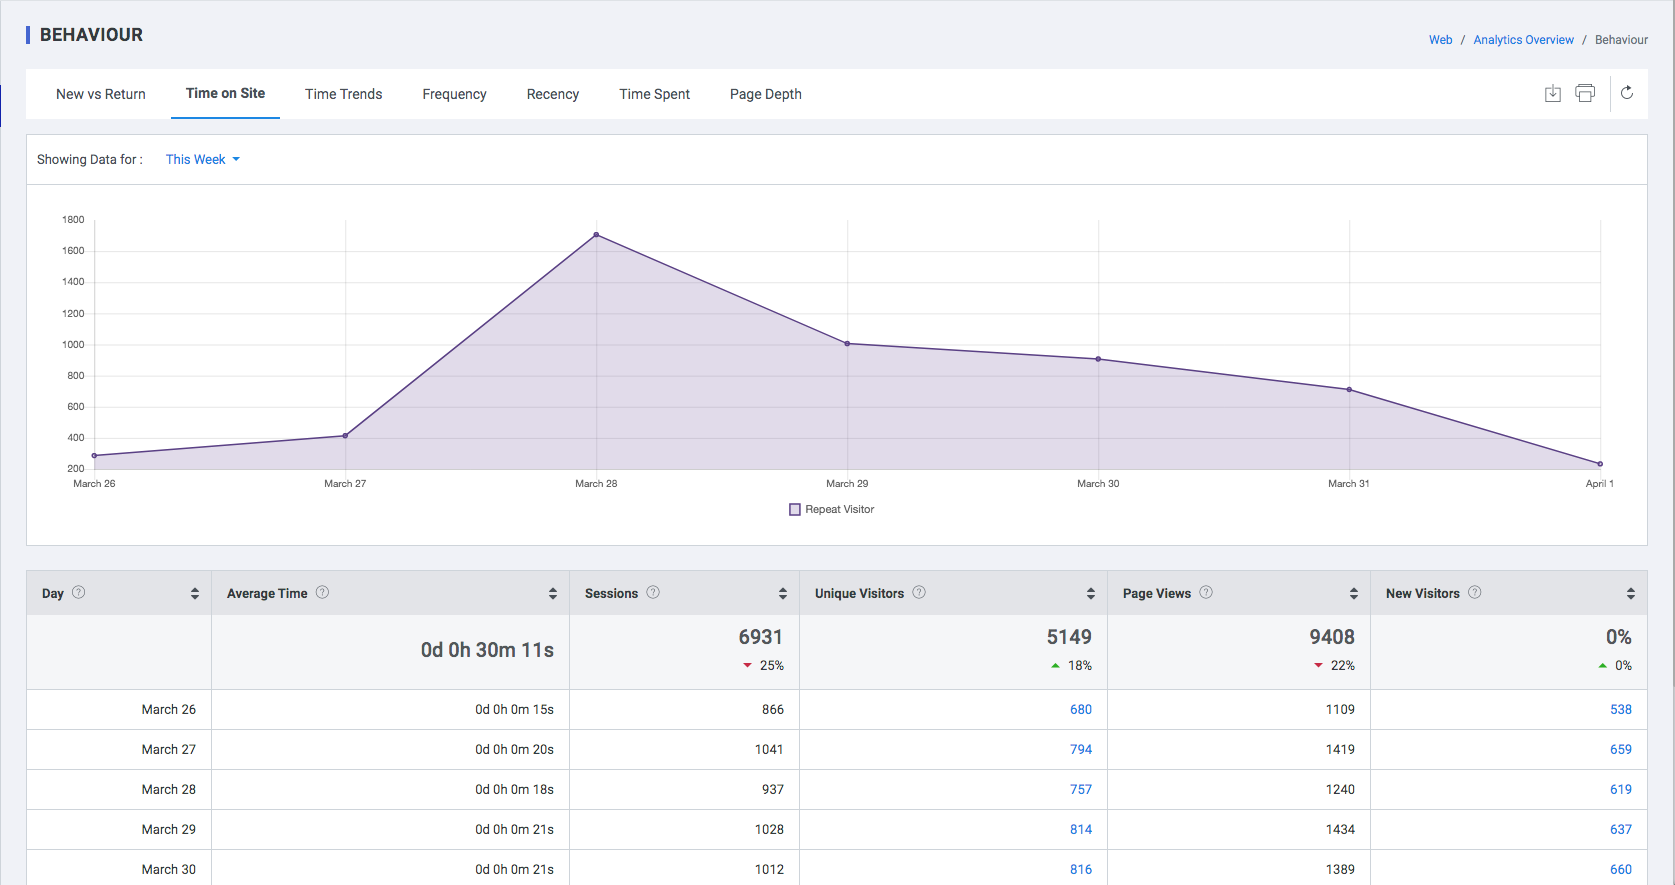
Time on App
Time on Mobile Application is a type of visitor report that provides data on the amount of time (in minutes or seconds) visitors have spent on your Mobile Application.
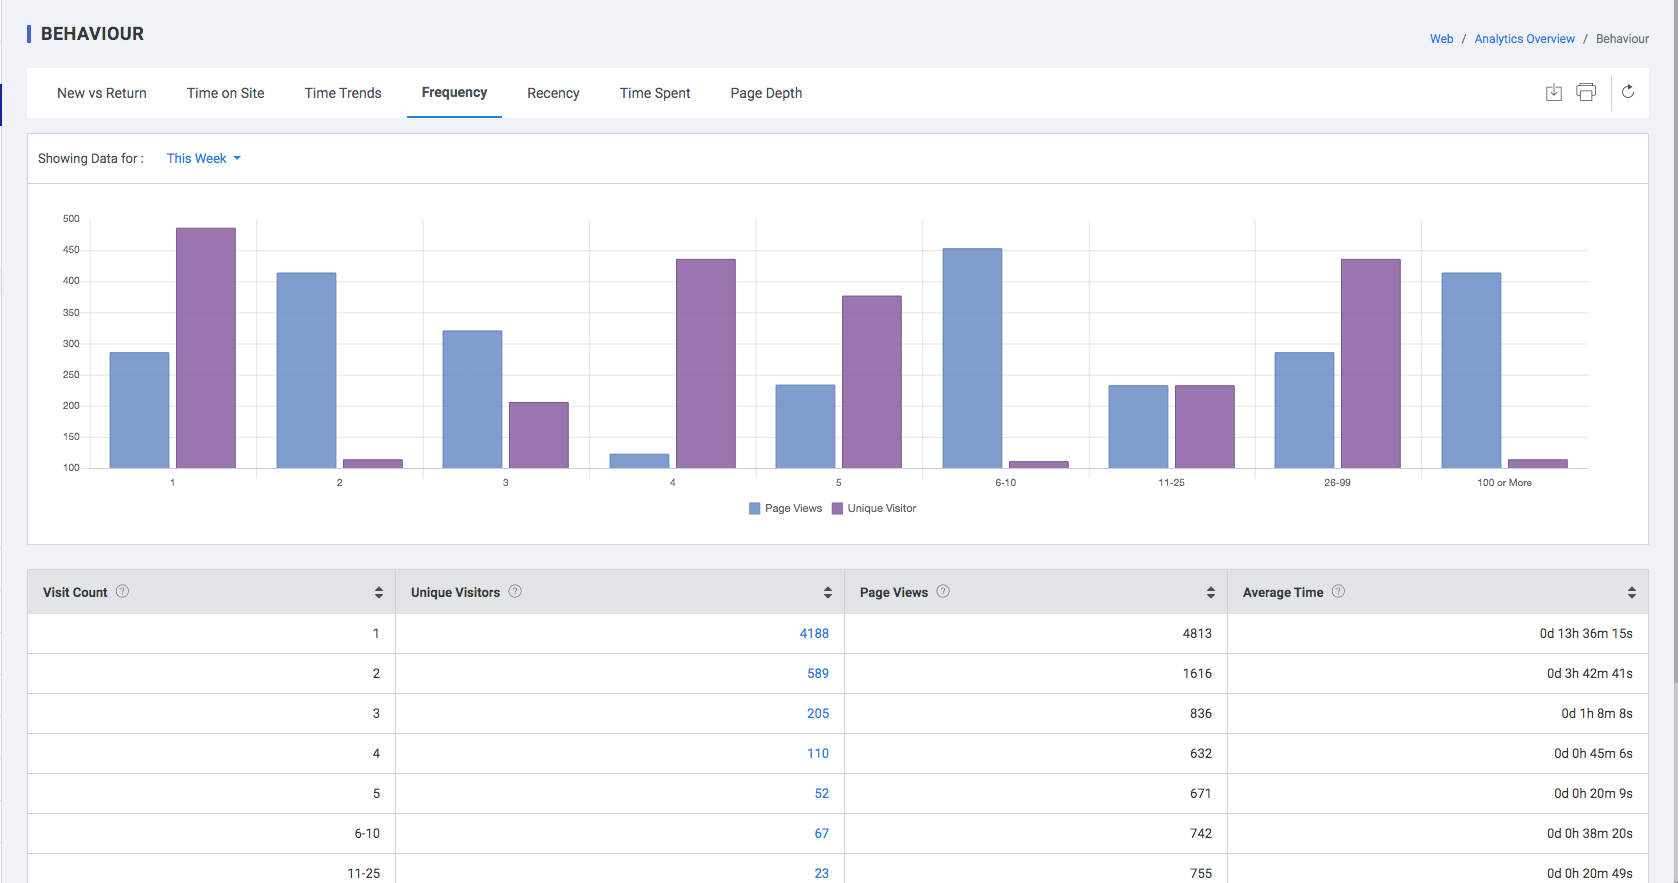
Frequency
Frequency of Mobile Application visits indicates the overall number of visits made by each user on your Mobile Application. This metric allows you to assess the percentage of new users on the Mobile Application as well as the familiarity level of all returning users.
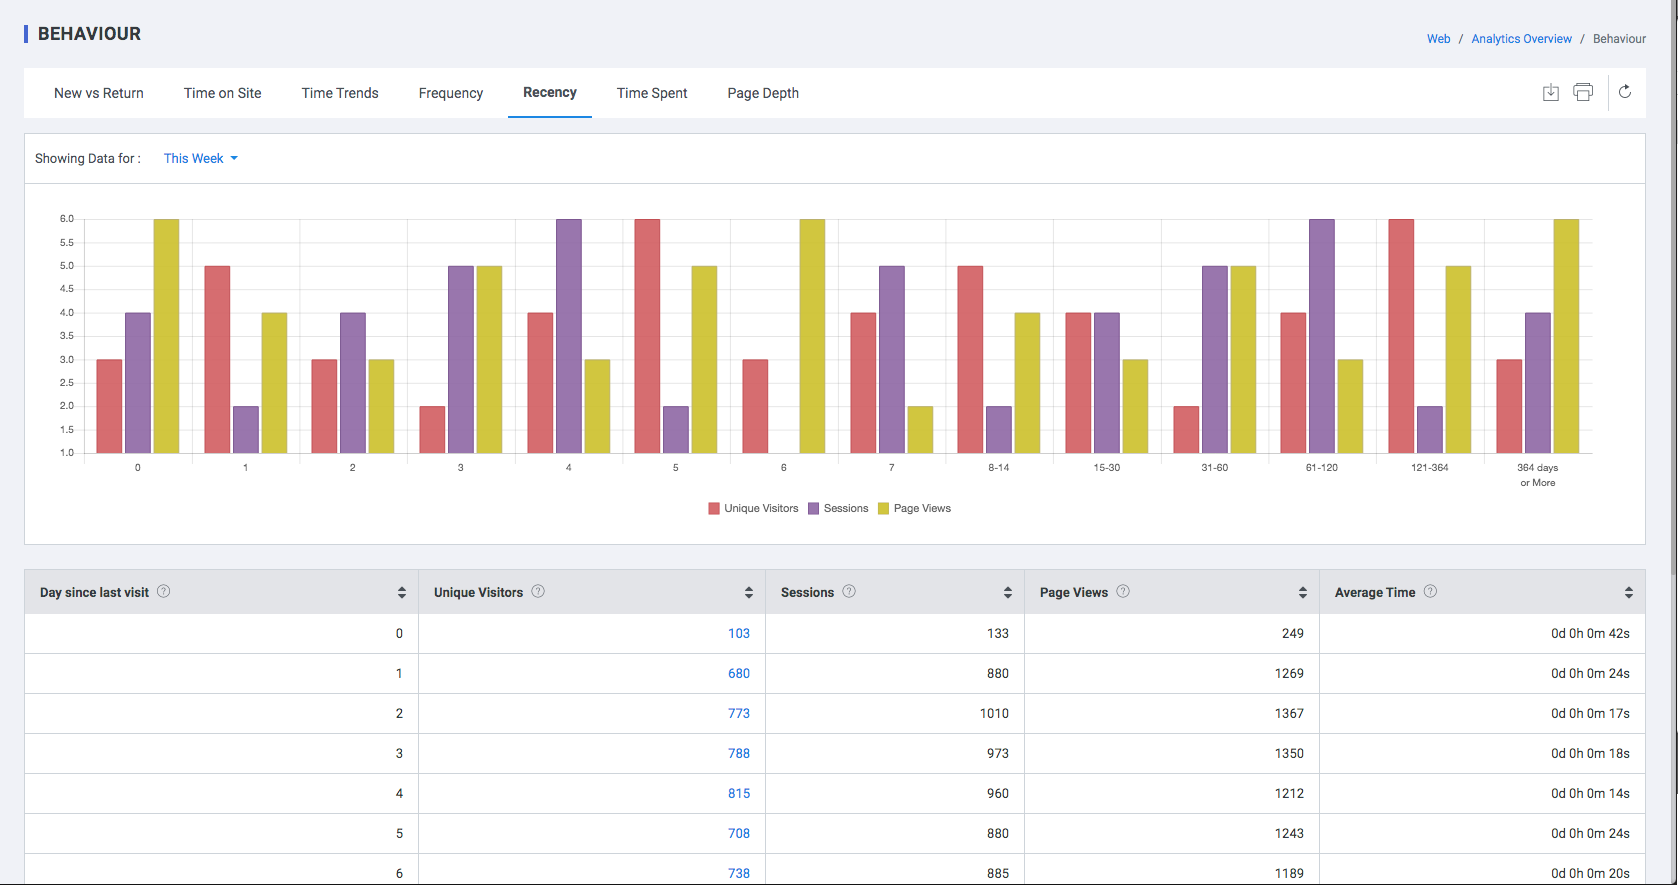
Recency
Recency measures the number of days that have passed since each user’s last visit. This measure allows you to see the average amount of time between visits for your user base.
Combined, frequency and recency measure how “sticky” an app is — do people return regularly to it or not? Analyzing the behaviors of loyal customers can lead to valuable insights — for example, you may find pages or tools used frequently by returning users, but ignored by occasional visitors. When you uncover such trends, you can then adjust the design of the Mobile Application to increase the discoverability of those features that your repeat users find valuable.
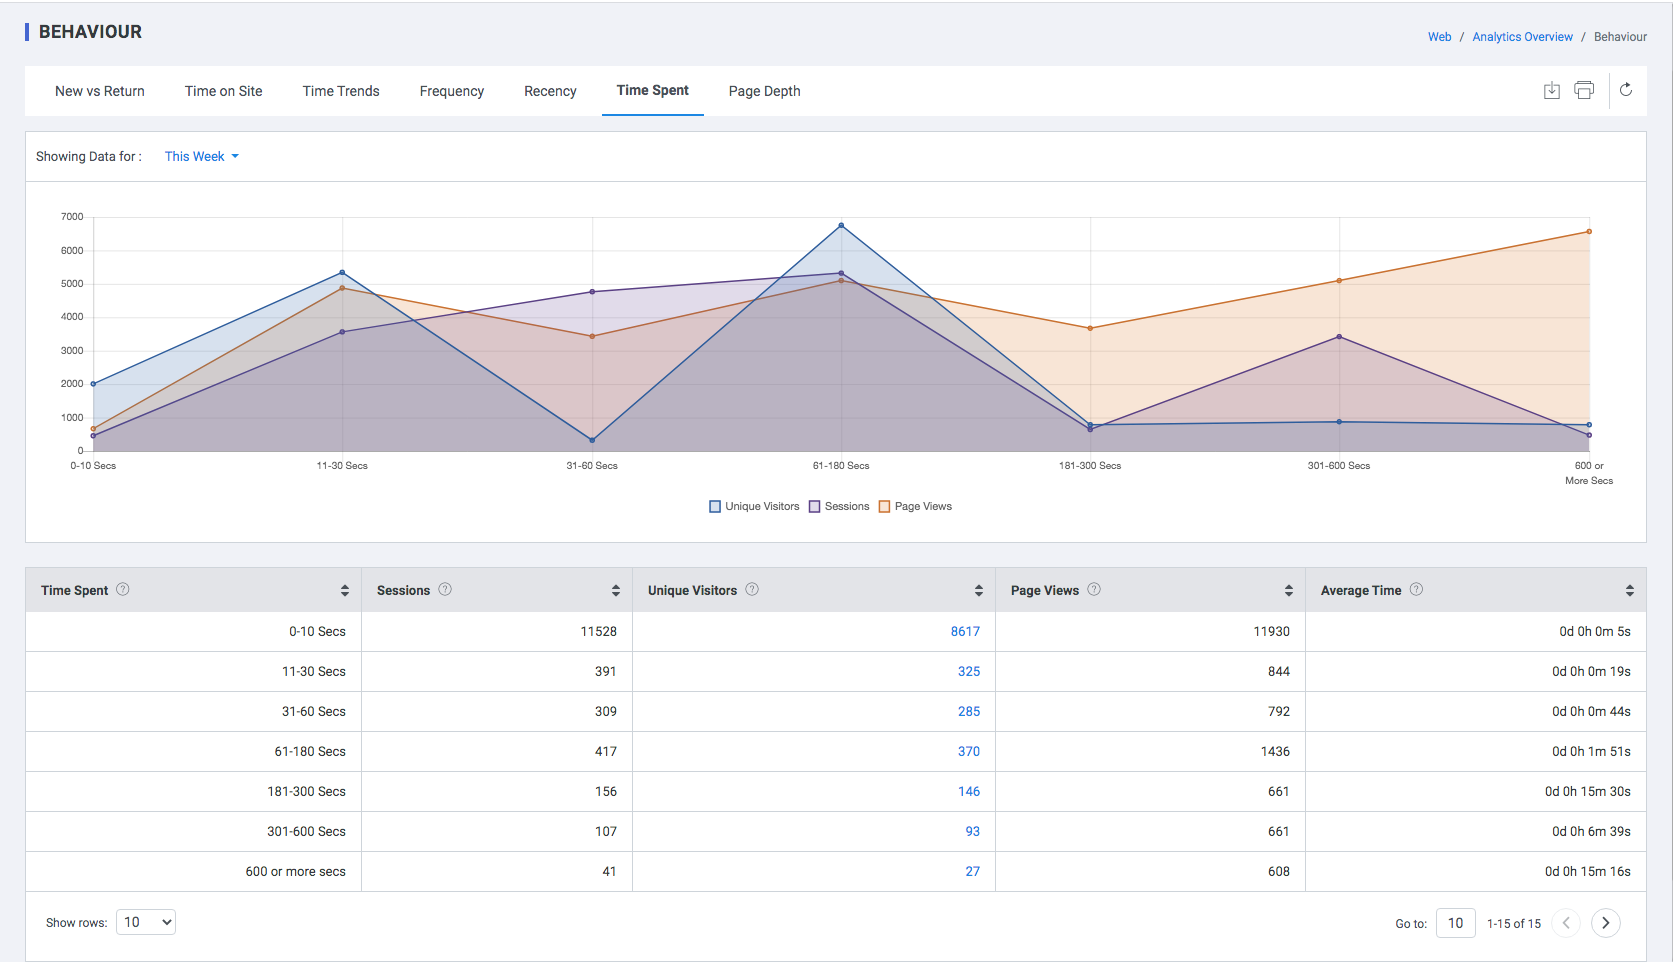
Time Spent
The average amount of time a user spends on the page on your Mobile Application