Content Analysis
Content Analysis reports help you to evaluate and measure how well the content on your Mobile Application is performing.
Popular Pages
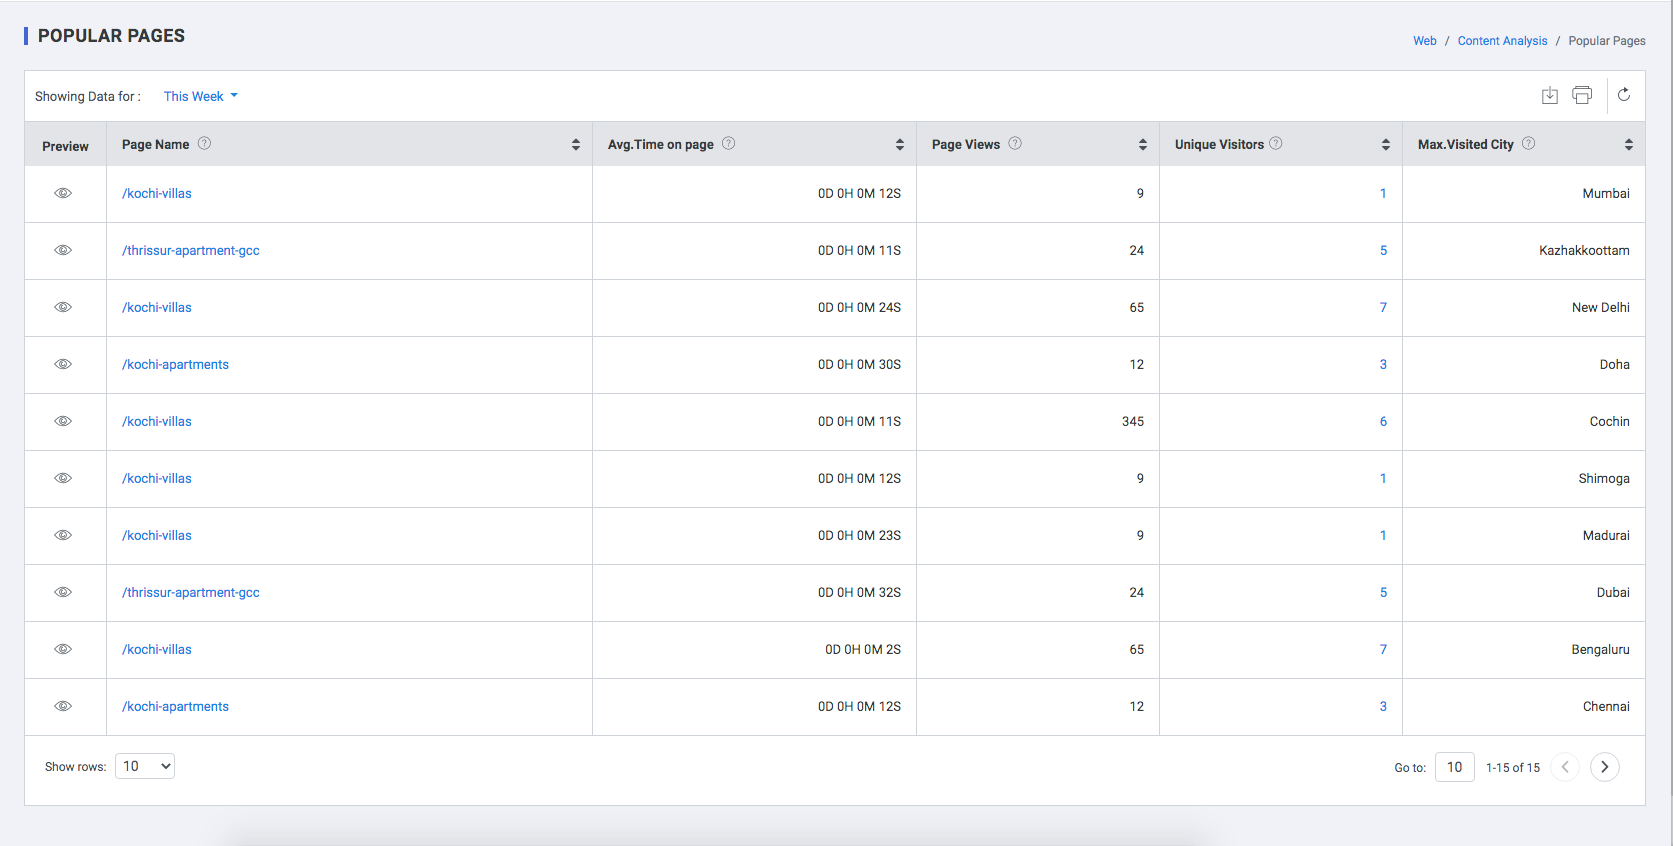
Page with the highest number of page views is considered to be a popular page. The popular pages are arranged in a descending order based on the number of page views. The maximum number of visitors from which city, who visited a particular page is also displayed along with the number of unique visitors visiting each of the displayed pages.
| Field | Description |
| Page | The most popular pages (based on the number of page views) are arranged in a descending order. This can be displayed in a time frame as defined by the user/p> |
| Avg. Time on Page | Average time spent by all the unique visitors visiting that particular page in a time frame defined by the user. The average time is total time/total sessions of the unique visitors |
| Page Views | Number of times the particular page was viewed by all the unique visitors in a time frame defined by the user |
| Unique Visitors | All the unique visitors who have viewed the page in a time frame defined by the user |
| Max.Visited City | Maximum number of unique visitors from a city visiting the particular web page, in a time frame as defined by the user |
Top Entry Pages
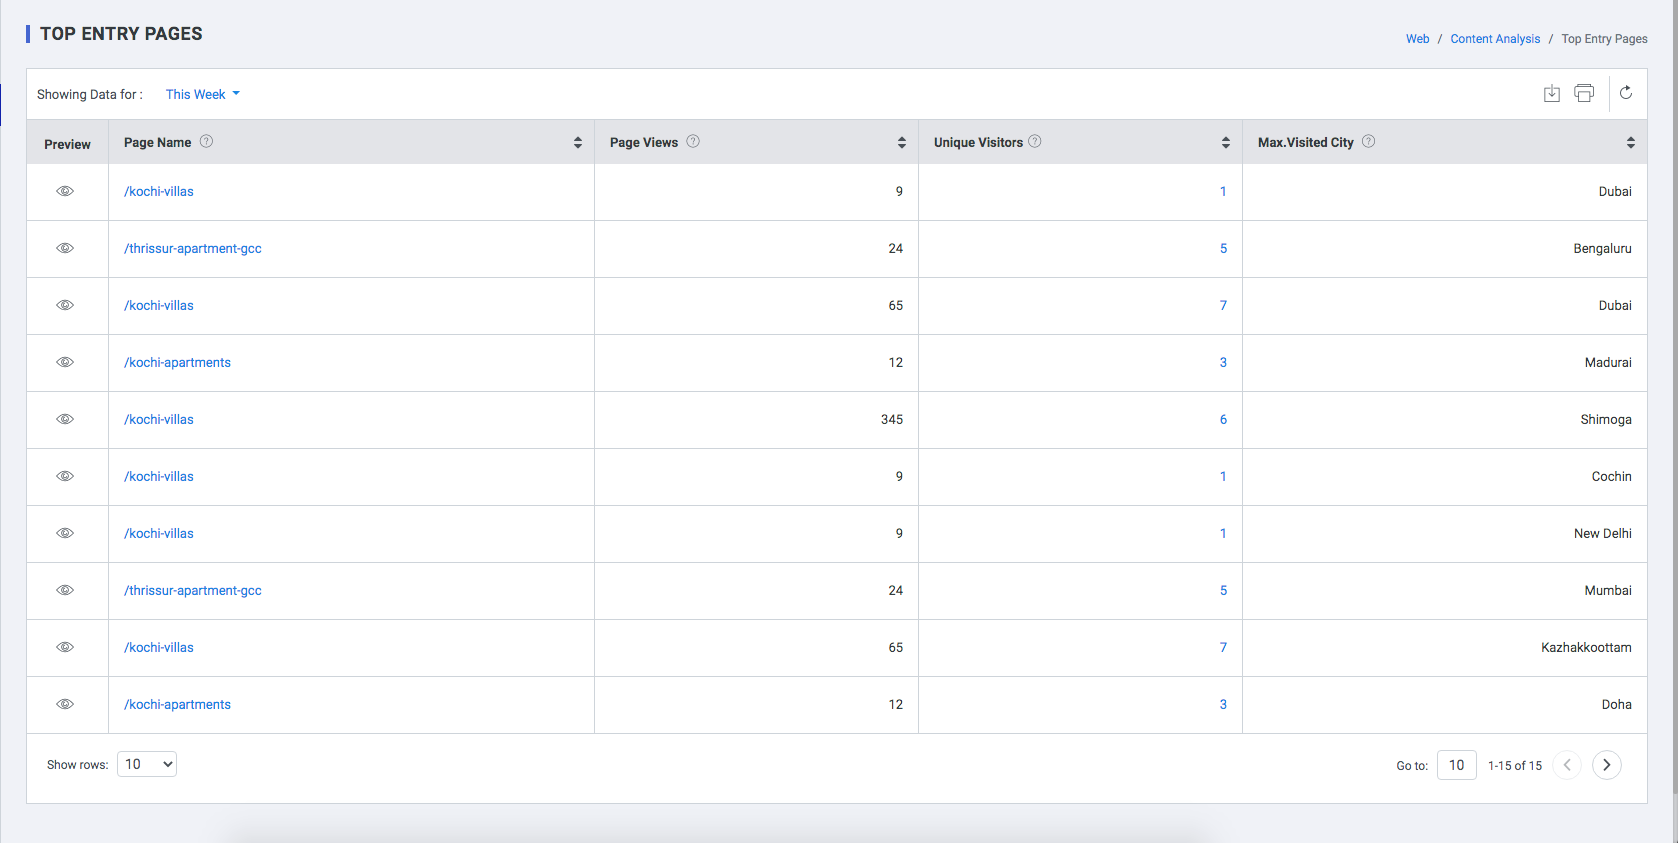
The top entry pages of the Mobile Application are displayed along with the number of unique visitors visiting the page and number of times they viewed it. The pages are ranked as top entry pages based on their page views.
| Field | Description |
|
Page Name |
Displays the names of the “top entry” pages i.e. the first entry pages |
|
Page Title |
Title given for the page in the HTML code |
|
Page Views |
Number of times the corresponding page was the first page of visit for the unique visitors displayed, in a time frame chosen by user |
|
Unique Visitors |
All those unique visitors whose first page of visit was the web page mentioned in “page name’ column, in a time frame chosen by user |
Importance of Top Entry Pages
Marketers utilizing Entry Pages should always begin with a question. It is one of several metrics that will help you find answers to clearly defined problems. Entry Pages is the ability to identify unexpected or sudden peaks in specific entry points.
Sources: it’s hard to do any meaningful analyses of Entry Pages data without also taking Traffic Sources into consideration. By combining these two, one can uncover surprising insights. For e.g:. Direct, referral or search sources landing: Visitors who have been referred from a search engine are most likely to enter the Mobile Application through the home page regardless of which terms they searched for. Similarly, for visitors visiting directly or clicking on organic linkages. So one needs to be better at optimizing most important subpages for differentiated keywords, so that the visitors find the specific service they are looking for immediately.
Campaign based Landing pages: Campaign related landing pages with offers etc. as an entry page work as points of entry.
Note: Both examples deal with pages that are the most common points of entry, not necessarily those pages which are the most popular (most visited) overall, although there will usually be some kind of correlation.
Market and location based: One way to check to what extent the localized pages work as entry pages in their respective markets is by combining information about your visitors’ geographical location with data on their preferred entry pages, One can uncover whether a specific local audience is finding your Mobile Application through content in their own language. To go even further, one can combine this knowledge with data from your Heat Maps to answer questions like:
- If visitors are entering your Mobile Application through localized pages are they then more likely to take the next steps you want them to?
- How many visitors entering your Mobile Application through the non-localized home page are choosing to change content language in the language selector and how many are fine with navigating the Mobile Application in the default language?
Top Exit Pages
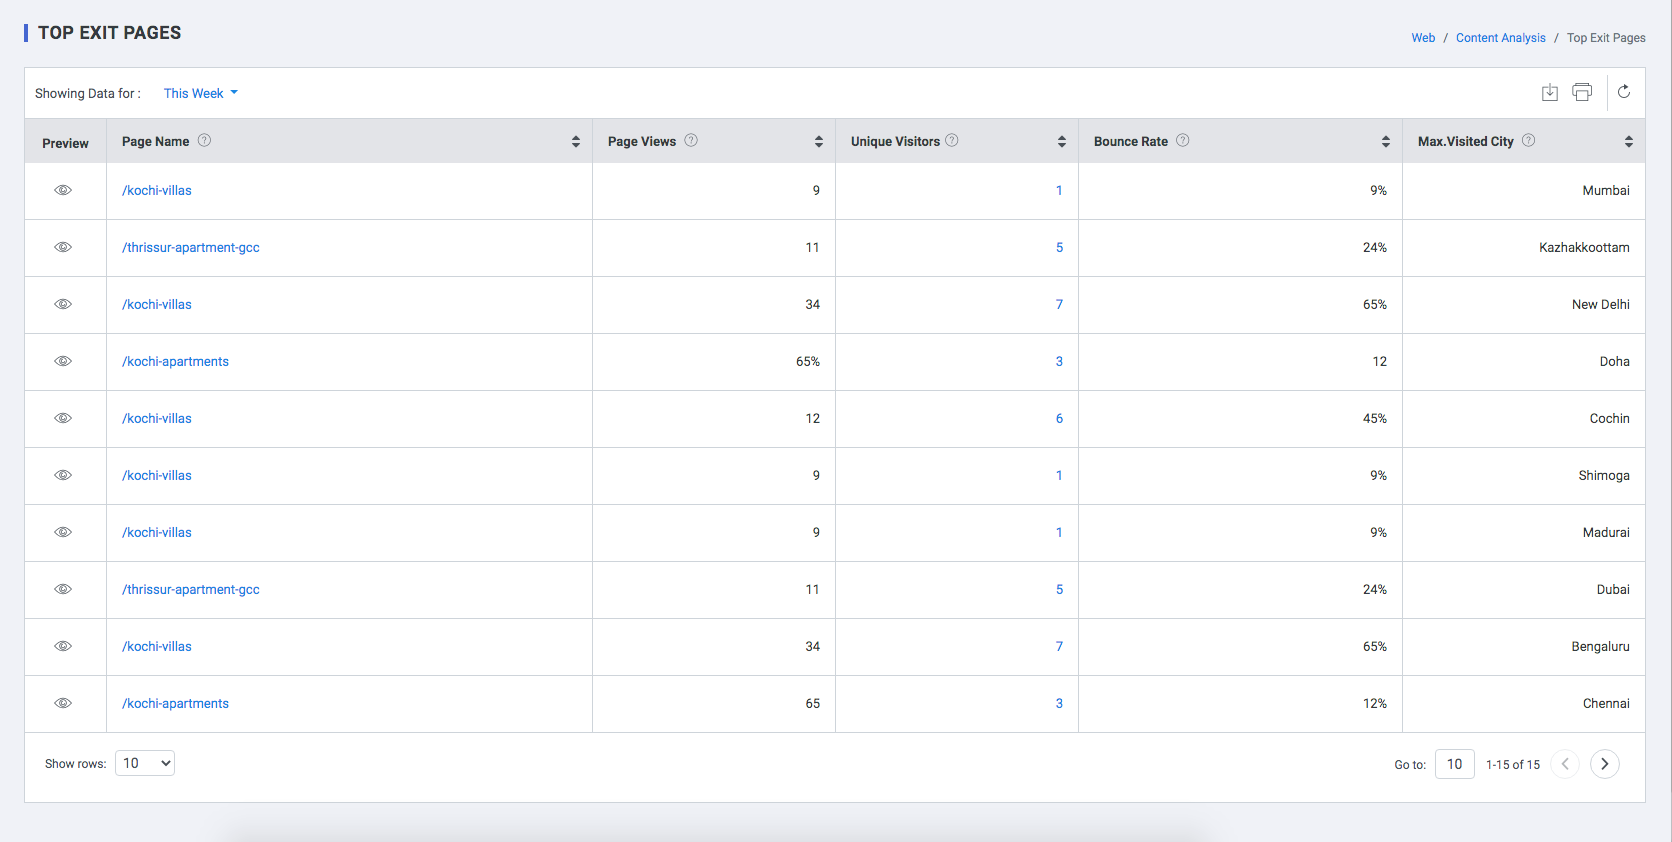
Top exit page is the last page of the Mobile Application accessed by a unique visitor during a visit or session. It signifies the end of a visit/session. The top exit pages are rated according to the number of page views ( i:e the last time they were seen) from highest to the lowest. This report gives you a breakdown of the number of Exits, pageviews and the % Exits.
Occasionally it’s worthwhile revisiting a well-established / standard metric or report and taking a fresh look at it. The metric of Exit Rate, are not often the first metric marketers look at when analysing their Mobile Application performance. Many marketers confuse bounce rate with exit rate but exit rates show a Mobile Application’s outflow. Where do users leave from after they start their session? This report should show and highlight which pages businesses should focus on to increase the chances of conversion.
It’s important to note that looking at this report you will clearly see that a lot of the high exit rate pages may not have anything to do with the conversion funnel. Users may visit the Mobile Application for various reasons and it’s important to highlight these scenarios and their journeys.
It is also important to understand that most Mobile Applications will have exit rates of around 97% (mainly e-commerce). Most of these exit pages will be pages you don’t want them to exit on. It’s hard to decide whether this is success or failure.
Exit rate is difficult, it’s important to understand the data and understand what your users may be doing. The reasons for an exit could be down to a user reading a review and then looking to buy in store, or picking up the phone to contact your company or are they exiting your Mobile Application because of usability issues.
Top exit page analysis is a good way to highlight areas that may need focus but it is important to understand that there are more factors to Mobile Application exit than just poor usability or communication.
| Field | Description |
| Page Name | Last page of visit of the unique visitors |
| Page Title | The title given for the page in the HTML code |
| Page Views | Number of times the corresponding page was the last page of visit for the unique visitors displayed, in a time frame chosen by user |
| Unique Visitors | All those unique visitors whose last page of visit was the web page mentioned in “page name’ column, in a time frame chosen by user |
| Bounce Rate | The percentage of visitors to a particular Mobile Application who navigate away from the Mobile Application after viewing only one page |
Event Tracking
Use Events to collect data about interactions with your content.
Events are user interactions with content that can be measured independently from a web-page or screen load. Downloads, link clicks, form submissions, and video plays are all examples of actions you might want to analyze as Events.
In this section the events can be tracked and recorded independently based on user interaction with Mobile Application elements. Events are user interactions with content that can be tracked independently from a web page or a screen load. Downloads, Banner clicks, Tab element clicks, video plays are all examples of actions you might want to track as Events.
Add Events
Filter By