Overview Dashboard
Marketers employ an artistic sensibility and a scientific approach to data and analytics. Marketing Dashboards reconcile these qualities by providing teams with visually appealing and easy-to-read displays of key marketing metrics. By tracking metrics on a daily, weekly, and monthly basis, marketers can act on data to immediately improve performance.
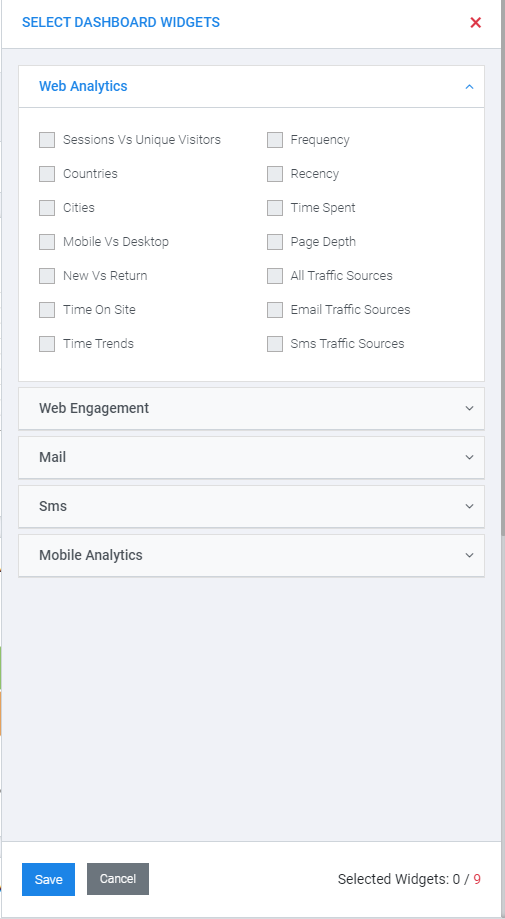
Plumb5 Overview dashboard is a reporting module that displays marketing analytics, KPIs, and metrics from all the individual modules. The user can select upto 9 Widgets from any of the modules that he is subscribed to and add it to the overview dashboard.
Main Navigation
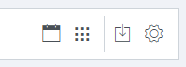
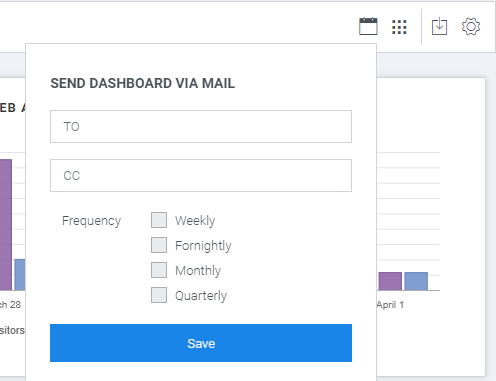
Scheduled Mail
Send the dashboard report via mail on a Weekly, Fortnightly, Monthly & Quarterly
Rearrange
Unlock the dashboard grid to rearrange the widgets as per your requirement. Clicking on the Save button ,locks your configuration and saves the arrangement to the database.
Download
Download the Dashboard as a PDF.
Settings
Select widgets from the right side screen to add to your dashboard. You can add up to a total of 9 Charts to this dashboard.