Dashboard
Live chat is a great communication channel for businesses to handle real time conversations and deliver higher levels of customer satisfaction. It also provides an easy way for customers to quickly reach out to your business to report their queries and issues.
Unless you monitor your live chat metrics and KPIs, and have an effective strategy for business growth, it is difficult to find out what is working and what is not. Hence, live chat performance analytics are essential to evaluate the effectiveness of your live chat and know the areas you need to improve.
Plumb5’s Live Chat Dashboard provides a thorough understanding of the key performance indicators (KPIs) for Live chat
Charts
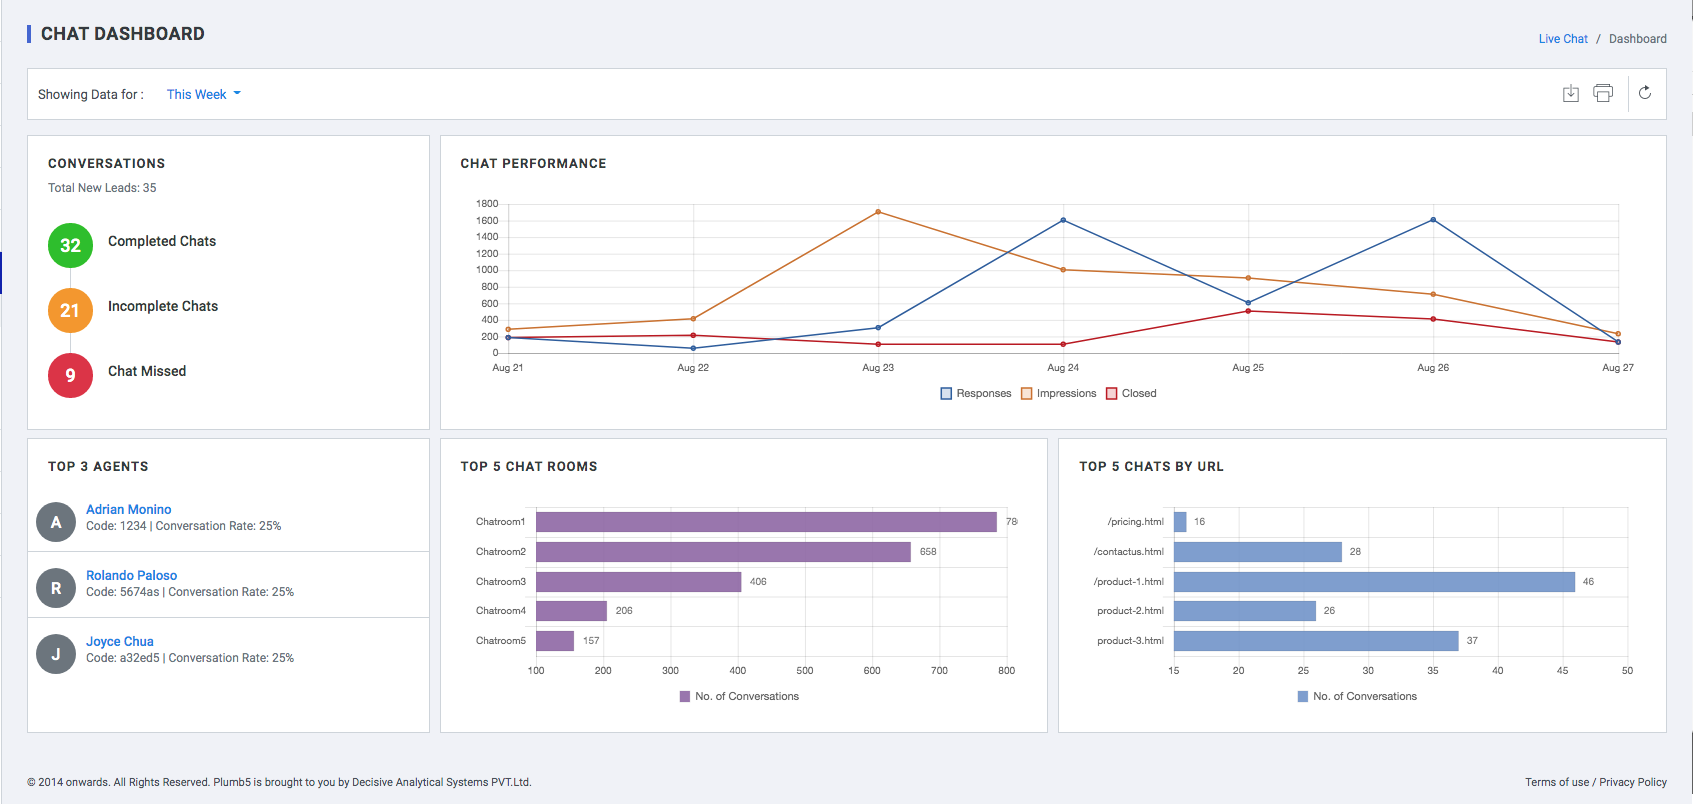
Conversations Widget
The number of chats is the total queries you receive during a specific time duration – it can be a day, a week, or a month. The number of chats can vary depending on the type of business, the time of the year, and the number of other available channels of communication.
Track the number of live chats in the following categories and set up goals and next steps for each:
- Incomplete Chats – Try to contact and follow up.
- Missed Chats – Follow up as soon as possible.
- Completed Chats – Follow up with feedback forms to assess customer satisfaction.
Top 3 Agents
Measuring customer service is crucial to understanding what customers think about your business and helps to fill the gaps to make good customer service, great!
This widget gives you the top 3 performers
Chat Performance over Time
When you use live chat software on your website to offer support, you’ll have to accurately gauge how many agents you need to man the ship. Measuring the number of total chats that are raised by visitors each day,week or month tells you how many agents are required.
The chat responses of the visitor are displayed on Daily, Weekly, Monthly and Yearly basis. The graph above represents the following criteria regarding customer interaction -
- Blue line represents the chat responses from the customer
- Orange line represents for customer Impressions
- Red line represents for closed chat interaction
Top 5 Chat Rooms
This metric helps measure the activity in your chat rooms. For example
Average number of parallel chats. How many chat sessions are happening at any given time? This also helps you understand the overall load on the system. Combining all of these allows for better resource planning for the peaks and troughs of your support center.
Although you can get significantly more granular with your data, this snapshot provides the main metrics you should consider tracking to ensure customer satisfaction, agent effectiveness, and overall support workflow, efficiency, and cost.
Top 5 Chat URLS
This metric helps measure engagement levels between your customers and your website. To create even more valuable insights, combine this data with time spent on site. If customers are spending only a little time, and the website visitor to chat ratio is also low, then you may need to make changes to your website to encourage visitors to interact with live chat agents.