

With Product list integration, you can now dish custom reports based on categories, sub categories or by individual products. You can even create custom product related reports and gather insights by adding various filters
Product-wise Performance Report
The report screen is a weekly report of an individual product. The report is customized after integrating product and purchase data from your store platform. This reports enables the marketer to monitor the conversion rate and identify susceptible pages in the goal paths causing drop-outs and plan optimization techniques
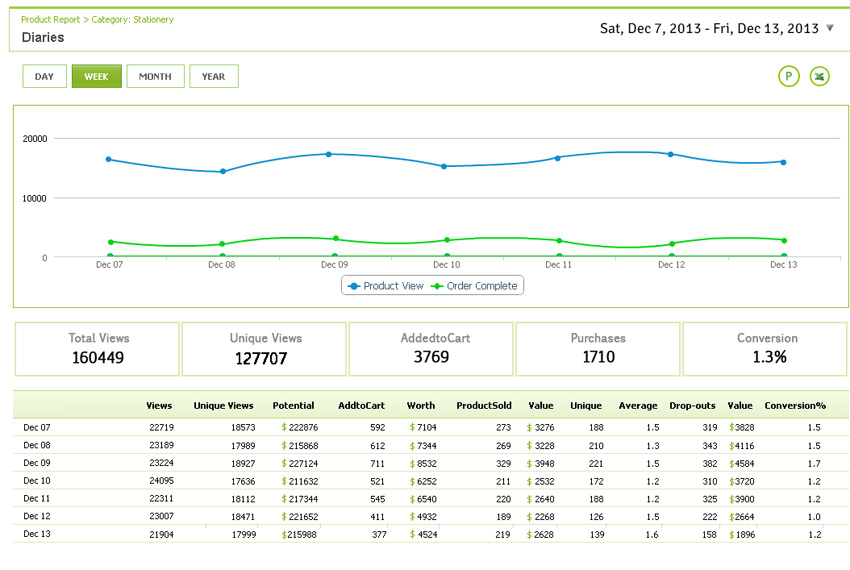
Views: Total Views the product received)
Unique Views: Total Unique Visitors who viewed the product
Potential: Total Potential Sales, considering all the unique visitors purchased at daily average(order)
AddtoCart: Total Unique Visitors who added the product to the cart
Worth: Total Worth, considering all the unique visitors who added to cart, made a purchase
Product Sold: Total Product sold
Value: Total successful purchases
Unique: Total Unique Customers who purchases the product
Average: An average number of products, every unique visitor purchases
Drop-outs – Total Unique Visitors who added to the cart but did not make the purchase
Value: Total Unsuccessful purchases
Conversion Rate: Total Percentage of successful purchases(value) with respect to total unique visitors who viewed the product (Potential)